Categorie: Tutti - equations - coordinates - graph

da Jolie Tang mancano 12 anni

353

Chapter 1

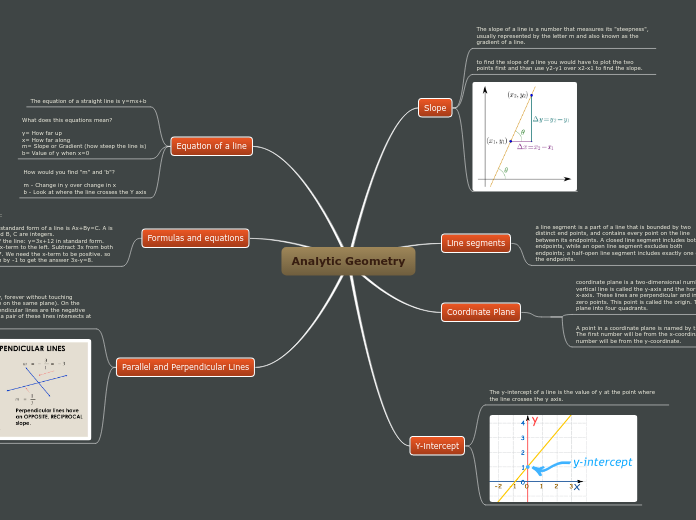
Linear equations in two variables can determine the relationship between two lines on a coordinate plane, specifically whether they are parallel or perpendicular. Parallel lines have the same slope, while perpendicular lines have slopes that are opposite reciprocals.

Chapter 1

Chapter 1: Section 2 Linear Equations in Two Variables By Jolie Tang


Parallel and Perpendicular Lines

Two lines, graphed on a coordinate plane, can end up being perpendicular or parallel and you can figure that out just by knowing their equations. Two lines will be parallel if they have the same slope. Two lines will be perpendicular if they have opposite recipricol slopes.
Example: y=5x-2 and y=x+7 are neither parallel nor perpendicular because they don't have and same slope and the opposite recipricol of 5 would be -1/5, not 1.
Perpendicular: Example: y=4x-3 and y=-1/4x+1 are perpendicular because the slope of the second equation is the opposite (negative to positive, or vice versa) and the recipricol (a/b to b/a) of the first equation.
Parallel: Example: y=9x+123 and y=9x-8 are parallel because they have the same slope/m variable of 9.

Finding Slope

Say you are given points A(1,3) and B(4, 9) and you are asked to find the slope. The slope of a line would be how steep the graph is so you want to know how far up or down the graph moves from one point to another. The equation you would use to find the slope when given two points is: Slope= (Change in y)/(Change in x), Rise/Run or: ----------> So you would plug in the numbers and get m= (4-1)/(9-3) = 1/2

Using Slope

Variable m in the linear equation represents the slope
If you are given a graph and cannot see the y-intercept, you can simply choose two coordinatesand find the slope and once you to that you can use the slope and plug either coordinate you have into the equation and find b.
If you are given the y-intercept of the graph (b), use the slope (m) to graph points after and create the line. For example, if the equation of a graph was y=2x+4, you would plot the y-intercept on a coordinate plane at (0,4), Next you would use the slope to plot the next point so you turn 2 into a fraction (2/1) you would move up the number on top and to the right the number on the bottom and repeat that until you have enough points to draw a line. The graph of this equation would look like this: