Brightview Senior Living
Market Opportunity (Adjusted)
Business Landscape
Competition (Number of Units)
{lower better}
[Number of Units within Boundary (Datastory & Nic)]
Raw # Units in 7-mile radius
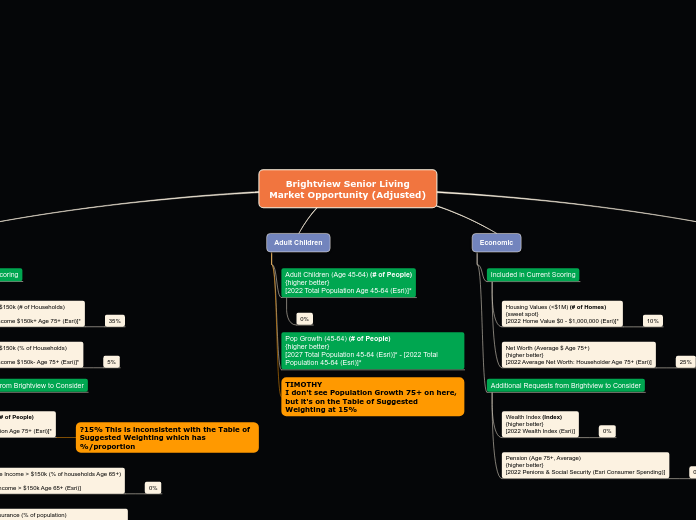
Economic
Pension (Age 75+, Average)
{higher better}
[2022 Penions & Social Security (Esri Consumer Spending)]
Wealth Index (Index)
{higher better}
[2022 Wealth Index (Esri)]
Net Worth (Average $ Age 75+)
{higher better}
[2022 Average Net Worth: Householder Age 75+ (Esri)]
25%
Housing Values (<$1M) (# of Homes)
{sweet spot}
[2022 Home Value $0 - $1,000,000 (Esri)]*
10%
Adult Children
TIMOTHY
I don't see Population Growth 75+ on here, but it's on the Table of Suggested Weighting at 15%
Pop Growth (45-64) (# of People)
{higher better}
[2027 Total Population 45-64 (Esri)]* - [2022 Total Population 45-64 (Esri)]*
Adult Children (Age 45-64) (# of People)
{higher better}
[2022 Total Population Age 45-64 (Esri)]*
Residents
Statistically Significant but Modified
Age 75+ Income < $150k (# of Households)
{lower better}
[2022 Household Income $150k- Age 75+ (Esri)]*
N/A
Additional Requests from Brightview to Consider
Age 65+ Living Alone Rate (% of people Age 65+)
{higher better}
[2021 Households w/Pop 65+: 1 Person (ACS 5-Yr)]
Long Term Care Insurance (% of population)
{higher better}
[2022 Personally Carry Long Term Care Insurance (Esri Market Potential)]
Age 75+ Disposable Income > $150k (% of households Age 65+)
{higher better}
[2022 Disposable Income > $150k Age 65+ (Esri)]
0%
Pop Growth (75+) (# of People)
{higher better}
[2022 Total Population Age 75+ (Esri)]*
?15% This is inconsistent with the Table of Suggested Weighting which has %/proportion
Included in Current Scoring
Age 75+ Income < $150k (% of Households)
{lower better}
[2022 Household Income $150k- Age 75+ (Esri)]*
5%
Age 75+ Income > $150k (# of Households)
{higher better}
[2022 Household Income $150k+ Age 75+ (Esri)]*
35%


