2 Donor reports plus 1 overall report
4 donor reports plus 1 overall report
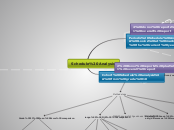
Schedule Analysis
Cohort Schedule analysis: from grade 10
Demographics
Race; sex;
Related Anova: Checking for linearity/differences throughout
TTP only
CHi square goodness of fit
range (IQR) comparison
75+
50 to 59
40 to 49
30 to 39
Fail
Grade 12 Mean Score comparison
Overall mean score comparison
NSC Vs TTP
IEB VS TTP
Real Vs Official
IEB Vs TTP
NSC VS TTP
Donor/overall TTP Marks Comparison
NSC/ IEB
2018 Grade 12
2016 Grade 11
2015 Grade 10
Periodic Schedule Analysis: Looks at marks for the current year
Methodology
Two sample T Test
Chi square for goodness of fit
Score mean comparison
TTP Mark Comparison per donor
School level comparison: we should also be able to identify learners at risk
Grade 11
Grade 10
Maths; Physical Science; English; Life science


