Products
Mind Mapping Software
Outlining Software
Gantt Charts Software
Uses
Mind Maps for Education
Mind Maps for Business
Mind Maps for Personal Development
Mind Mapping Benefits
Resources
Features
Education
Personal & Work
Desktop
Video Tutorials
Watch tips and tricks about using Mindomo.
Help Center
Detailed help guide on configuring and using Mindomo.
Articles
Top 29 Mind Map Examples
Gantt Chart Software
Concept Map Template
Free mind map software
What is a concept map?
Gantt Chart Maker
Mind Map App
Concept Map Maker
Mind map template
Pricing
Log in
Sign Up
Products
Mind Mapping Software
Outlining Software
Gantt Charts Software
Uses
Mind Maps for Education
Mind Maps for Business
Mind Maps for Personal Development
Mind Mapping Benefits
Resources
Blog
Video Tutorials
Help Center
What is Mind Mapping?
Create a Mind Map Online
Concept Map Maker
Articles
Top 29 Mind Map Examples
Gantt Chart Software
Concept Map Template
Free mind map software
What is a concept map?
Gantt Chart Maker
Mind Map App
Concept Map Maker
Mind map template
Features
Education
Personal & Work
Desktop
Pricing
Sign Up
Log in
Categories:
All
-
data
-
collection
-
frequency
by
Chris Ryall
9 years ago
318
GCSE 2016 Handling Data TGS
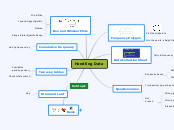
Data handling involves various techniques to organize and interpret information effectively. Techniques include cumulative frequency, which involves summing up frequencies to understand data distribution.
Open
More like this
Lesson 1: What is a digital footprint?
by Summer Ly
Visual metaphors
by J M
1.1 Understand computer storage and data types
by Gary Sibbitts
DSS
by reham ashraf
Demo
Subtopic
Handling Data
Stem and Leaf
Key
Two way tables
Check totals match
2 variables (usually gender)
Cumulative frequency
add up frequencies
Box and Whisker Plots
Range & Inter Quartile Range
Median
Lower & Upper Quartile
Min & Max
Questionnaires
Not biased
Biased question or options
Wrong people
Wrong location
Time period, eg per day or month
Response boxes
Complete (more than)
Not overlapping
Data Collection Sheet
Tally & Frequency
Frequency Polygon
Join the points, straight lines
Plot the midpoints