Key ideas:
Why is it important to teach students algebraic reasoning, and graphing? Why do student's need to make connections with geometry? Forty years from now, four plus four will still equal eight. Students need critical thinking skills so they can think through an issue, and reason logically to solve problems in the real world.
Teaching Algebraic Reasoning, Graphing, and Connections with Geometry
Teaching algebraic reasoning, graphing, and making connections with geometry can be confusing. The map is packed with tools to help a teacher. It includes games, videos, lesson plans, and tools to help your students succeed.
The map can also refresh those skills that may have been forgotten. The mind map will keep you organized and shows you how key concepts can be chunked together.
Additional References
References:
Alex Lesson Plans. Alabama Learning Exchange. Retrieved from
http://alex.state.al.us/lesson_view.php?id=26338
https://www.youtube.com/watch?v=k4KdGiJPbN8
Basics About a Circle.
http://www.areacircle.com/basics-about-area-of-a-circle.html
Basic Algebra. Basic Mathematics. Retrieved from
http://www.basic-mathematics.com/what-is-slope.html
Better Explained Math Insights with a Click. Retrieved from
http://betterexplained.com/articles/techniques-for-adding-the-numbers-1-to-100/
Brain Pop. Gopher Game. Retrieved from https://www.brainpop.com/games/gameovergopher/
Khan Academy. Coordinate Plane. Retrieved from
https://www.khanacademy.org/math/algebra-basics/core-algebra-graphing-lines-slope/core-algebra-graphing-coordinate-plan/v/plot-ordered-pairs
Math Worksheets 4 Kids. Retrieved from http://www.mathworksheets4kids.com/function/graphing-linear1.pdfPromethean Planet. Teaching Resources.
http://www.prometheanplanet.com/en/Search/resources/language/english/?Keywords=function+tables
PBS. Using Two Variables to Express Algebraic Equations. Retrieved from http://www.pbslearningmedia.org/resource/vtl07.math.algebra.var.lptwovaria/using-two-variables-to-express-algebraic-relationships/Purple Math. The Quadrants o the Cartesian Plane.
http://www.purplemath.com/modules/plane3.htm
Teaching Channel. Chessboard Algebra Function Machine. Retrieved from
https://www.teachingchannel.org/videos/algebra-lesson-planning
Writing Equations of a Line. Algebra Lab. Retrieved from http://www.algebralab.org/lessons/lesson.aspx?file=Algebra_LinearEqEquationsOfLines.xml
Lesson Plans and Additional Resources
Modeling with Mathematics
Graphing Two Variables to Express Algebraic Relationship
Algebra, geometry are not tow separate areas. Many of the same applications apply to both.
Graphing Linear Functions Worksheet
Teacher Channel Video
Function Tables
Function tables are lists of possible values of a variable and the function's result.
Alex Learning Lessons
Graphing Points, Lines, and Elementary Functions
Nonlinear Funtions
- A non-linear function is a not a linear function.
- A quadratic function is
f (x) = ax 2 + bx + c , where a, b, c if
a≠ 0 .
-Exponential function (see video)
Equations of Lines
First before beginning any computation it is important to
1. Make sure you understand the problem.
2. Devise a plan t help with the problem.
3. Carry out the plan or compute the problem.
4. Look back at how we solved the problem.
We need to study the problem to have a better understanding of what we are being asked. We need to decide how to solve it. Then it is important to being to solve it. Then reflect and look back at the solution.
What Theorem needs to be used.
1. The point-slope form is will be used when we are given a point (x1, y1) and a slope m. Then the numbers are plugged into the formula:
y – y1 = m(x – x1)
2. The slope-intercept form is used where m is the slope and b is the y-intercept.
y=mx+b
3 For the two-point form of the equation of a line we would use the formula
y – y1 = m(x – x1)
The slope and (x1, y1) is a point on the line. Point-slope is the form used most often when finding the equation of a line.
Functions:
-A linear function is a straight-line graph.
Slope
What is the slope? A real world example is walking up or down a flight of stairs.
The slope of a line defines the steepness of the line. It allows us to know if the line is rising or falling.
Slope = Rise
Run
The Distance Formula
We can use this formula to determine the distance between the two points (5,5) and (1,2) by using the formula.
The Cartesian Coordinate Plane
Quadrant I both coordinates are positive.
Quadrant II first coordinate is negative and second coordinate is positive.
Quadrant III both coordinates are negative.
Quadrant IV first coordinate is positive and second coordinate is negative.
Plotting points
Example of Graph Quadrants
References
References:
Ehow. How to Use Functions to Teach Algebra. Retrieved from http://www.bing.com/videos/search?q=how+to+use+functions+tables+youtube&FORM=VIRE7#view=detail&mid=D23955324C10AFD5B81ED23955324C10AFD5B81E
Graph Game. Retrieved fromᅠ
http://www.mathxl.com/Student/MediaPopup.aspx?type=assignedmedia&assignmentId=283516755&loc=3&flush=yes&record=1&OnOpenerViewed=doMedia_onViewed
Graphic. Retrieved from http://www.jackanderica.com/math/images/plot007.jpg
IXL.
http://www.ixl.com/math/grade-3/solve-for-the-variable-addition-and-subtraction-only
ᅠ
Long, C. et al. (2015). Mathematics Reasoning for Elementary Teachers. Boston, MA. Pearson
Math Help. Mapping Diagrams. Retrieved from http://www.bing.com/videos/search?q=functions+as+arrow+diagrams+video+algebra&FORM=VIRE5#view=detail&mid=49B4EB35DDBD9F4C138949B4EB35DDBD9F4C1389
Math Plant. Retrieved from
http://www.mathplanet.com/education/algebra-1/discovering-expressions,-equations-and-functions/expressions-and-variables
Math XL. Retrieved from http://www.mathxl.com/Student/MediaPopup.aspx?type=assignedmedia&assignmentId=283516755&loc=4&flush=yes&record=1&OnOpenerViewed=doMedia_onViewed
Solving Equations. Retrieved from http://www.sosmath.com/algebra/solve/solve0/solve0.html
Think Math. Retrieved from
http://thinkmath.edc.org/resource/guess-my-rule
References:
Ehow. How to Use Functions to Teach Algebra. Retrieved from http://www.bing.com/videos/search?q=how+to+use+functions+tables+youtube&FORM=VIRE7#view=detail&mid=D23955324C10AFD5B81ED23955324C10AFD5B81E
Graph Game. Retrieved from
http://www.mathxl.com/Student/MediaPopup.aspx?type=assignedmedia&assignmentId=283516755&loc=3&flush=yes&record=1&OnOpenerViewed=doMedia_onViewed
Graphic. Retrieved from http://www.jackanderica.com/math/images/plot007.jpg
IXL. Retrieved from
http://www.ixl.com/math/grade-3/solve-for-the-variable-addition-and-subtraction-only
Mathematics. Long, C. et al. (2015). Mathematics Reasoning for Elementary Teachers. Boston, MA. Pearson
Math Help. Mapping Diagrams. Retrieved from http://www.bing.com/videos/search?q=functions+as+arrow+diagrams+video+algebra&FORM=VIRE5#view=detail&mid=49B4EB35DDBD9F4C138949B4EB35DDBD9F4C1389
Math Plant. Retrieved from
http://www.mathplanet.com/education/algebra-1/discovering-expressions,-equations-and-functions/expressions-and-variables
Math XL. Retrieved from http://www.mathxl.com/Student/MediaPopup.aspx?type=assignedmedia&assignmentId=283516755&loc=4&flush=yes&record=1&OnOpenerViewed=doMedia_onViewed
Solving Equations. Retrieved from http://www.sosmath.com/algebra/solve/solve0/solve0.html
Think Math. Retrieved from
http://thinkmath.edc.org/resource/guess-my-rule
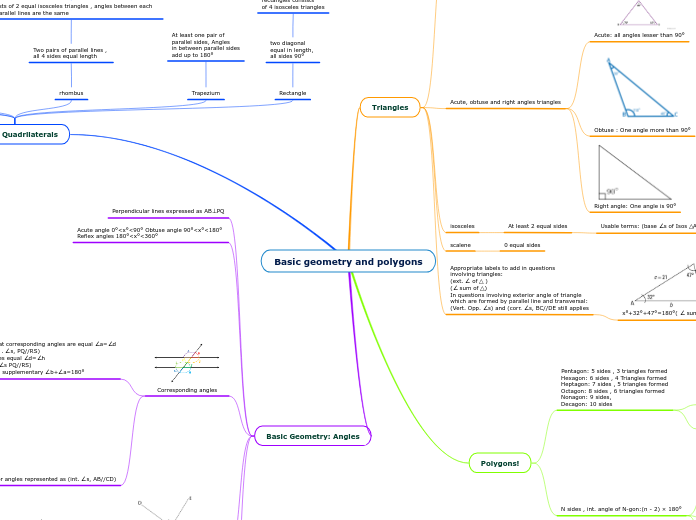
Connection between Algebra and Geometry
Math is integrated into many different areas such as geometry, probability, and algebra. They will continue to keep building on one another.
Circles
Picture a circle and you are standing in the center of it. If you were to run from the center to the outside edge in a straight line that distance is the radius.
Using the circle analogy again, if you were to run in a straight line through the center of the circle and end on the other side this would be the diameter.
Using a circle and running around edge of the circle is called the circumference.
Parallel and Perpendicular Lines
Parallel lines are parallel if they are always the same distance apart and will never meet. Therefore, their slopes are always the same.
Perpendicular lines are if they meet at a right angle (90°).
Variables, Algebraic Expressions, and Connections with Geometry
Describing and Visualizing Functions
We can solve equations by using visual functions such as "What's my rule, function tables, arrow diagrams, machines, and graphs."
Example as graphs
A graph allows you to visualize data sets.
Example of the Fibonacci sequence and the doubling function
Example Functions as arrow diagrams
Example for Function as tables
A math function table is a table used to plot possible outcomes.
Example Functions as formulas
Defining and Visualizing Functions
The definition of function requires that a single value y be assigned to each x-value in the domain.
Example,
We are at the gas station, filling the vehicle with gas which is priced at $3.95 per gallon. As we know from filling our gas tank that day the amount is a function of the amount of gas purchased. Letting the variable (output) represent the final bill in dollars and cents, then y is defined by the rule y=3.95s. Machines help us compute this formula into a dollar amount
"How much does 15 gallons cost?" The answer is $59.25. This is the only cost of the gas because there is only one value for y for each x.
Solving Equations
An equation is a mathematical expression starting that two algebraic expressions have the same value.
Algebraic Expressions
Algebraic expression is a representation that involves variables, numbers, and operations symbols.
The cost of a gallon of milk in the store is increased by 20 cents. What is the cost of a gallon of milk that used to cost c dollars? What is the old cost of the old gallon of milk that now costs d dollars?
Answer:
c+0.20
d-.20 (in dollars)
Variables
Lets start with algebraic reasoning. Here are some topics we will cover.
• What are variables?
• How to form algebraic expressions involving variables, numbers, and operation symbols?
• What is the definition and visualization of functions
Variables used in algebra are letters such as x, y, f, or any letter to represent unknown numbers.
Variables express formulas
COMMONLY USED FORMULAS
1, Distance
Variables:
d= distance traveled
r= rate of travel (speed)
t= time of travel
Formula: d = rt
2. Perimeter of a rectangle
Variables:
p = perimeter
l= length
w= width
Formula: P = 2L + 2W
3. Area of a rectangle
Variables:
A= area
Formula: A= LW
Variables serve as unknowns in equations
Find a number to place in the blank that makes the sentence true.
__ + 7 = 9
or
(3x-6)(x-2)=0
Variables express relationships
Variables express relationships here are some examples.
J=K-6 ("Addy is six years younger than Kendra")
K=J+6 ("Sara is six years older than Addy.")
K-J=6 ("The difference in age between Sara and her younger sister Addy is six years.")
Variables describe generalized properties
Example
Example:
a(b+C) = ab+ac
Constants
A constant is a non-changing value that represents a fixed number.
Here are several examples of a constant
3, 10, π, 1/2.
Examples
There are 12 in a dozen of eggs
There are four sides of a rectangle
and
2 + 5 = 7


