Index: relates the value of a variable to a base level, which is often the value on a particular date
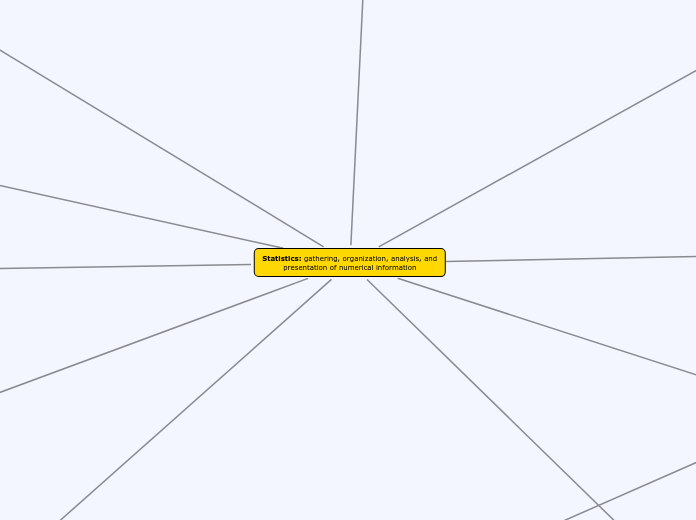
Statistics: gathering, organization, analysis, and presentation of numerical information
Critical Analysis
When evaluating claims based on statistical studies, you must assess the methods used for collecting and analyzing the data
- Is the sampling process free from intentional and unintentional bias?
- Could any outliers or extraneous variables influence the results?
- Are there any unusual patterns that suggest the presence of a hidden
variable?
- Has causality been inferred with only correlational evidence?
Lurking Variable
extraneous variables that are difficult to recognize
Hidden Variable
statistics from some sources are sometimes flawed by unintentional or, occasionally, entirely deliberate bias
Although the networks and major newspapers are reasonably careful about how they present statistics, you should be particularly careful about accepting statistical evidence from sources that could be biased
To judge the conclusions of a study properly, you need information about its sampling and analytical methods
Cause and Effect Relationships: a change in X produces a change in Y
Presumed Relationship
a correlation does not seem to be accidental even though no cause-and-effect relationship or common-cause factor is apparent
Accidental Relationship
a correlation exists without any causal relationship between variables
Reverse Cause-and-Effect Relationship
the dependent and independent variables are reversed in the process of establishing causality
Common-Cause Factor
an external variable causes two variables to change in the same way
Regression: is an analytic technique for
determining the relationship between a dependent variable and an independent variable
Non-Linear Regression
Polynomial Regression: analytic technique used for finding the polynomial equation that best models the relationship between two variables
Power Regression: the curve of best fit has an equation with the form y = axb
Exponential Regression: produces equations with the form y = ab x or y = ae kx
e = 2.718 28
an analytical technique for finding a curve of best fit for data from such relationships
Linear Regression
Extrapolation
estimating beyond the range of the data
Interpolation
estimating between data points
Least-Squares Fit: an analytic method that gives more accurate results for correlations
Scatter Plots and Linear Correlation
Scatter Plot: shows such relationships graphically, usually with the independent variable as the horizontal axis and the dependent variable as the vertical axis
Line of Best Fit: is the straight line that passes as close as possible to all of the points on a scatter plot
Linear Correlation: when the independent and dependent variables are proportional
Perfect Positive (or direct) Linear Correlation: if Y increases at a constant rate as X increases
Dependent Variable: a variable that is affected by an independent variable
Perfect Negative (or inverse) Linear Correlation: if Y decreases at a constant rate as
X increases.
Independent Variable: a variable that affects a dependent variable
Measures of Central Tendency: different ways to find values around which a set of data tends to cluster
measures of central tendency indicate
the central values of a set of data. Often,
you will also want to know how closely the
data cluster around these centres
Measures of Spread
Percentiles: divide the data into 100 intervals that have equal numbers of values
Quartiles: divide a set of ordered data into four groups with equal numbers of values, just as the median divides data into two equally sized groups
Semi-Interquartile Range: one half of the interquartile range
Inquartile Range: the range of the middle half of the data
Box-and-Whisker Plot: illustrates these measures
Modified Box-and-Whisker Plot: often used when the data contain outliers
Deviation: the difference between an individual value in a set of data and the mean for the data
Outliers: are values distant from the majority of the data
Mode: the value that occurs most frequently in a distribution
Median: the middle value of the data when they are ranked from highest to lowest
Mean: defined as the sum of the values of a variable divided by the number of values
Weighted Mean: gives a measure of central tendency that reflects the relative importance of the data
Bias
Response Bias: occurs when participants in a survey deliberately give false or misleading answers
Measurement Bias: occurs when the data collection method consistently either under- or overestimates a characteristic of the population
Non-response Bias: occurs when particular groups are under-represented in a survey because they choose not to participate
Sampling Bias: occurs when the sampling frame does not reflect the characteristics of the population
Statistical Bias: any factor that favors certain outcomes or responses and hence systematically skews the survey results
Loaded Questions: questions that contain wording or information intended to
influence the respondents’ answers
Leading Questions: questions that prompt or encourages a desired answer
Sampling: method of choosing specific individuals that are part of the population being studied
Convenience Sample: sample is selected simply because it is easily accessible
Voluntary-Response Sample: researcher
simply invites any member of the population to participate in the survey
Multi-Stage Sample: uses several levels of random sampling
Cluster Sample: certain groups are likely to be representative the entire population
Stratified Sample: population includes groups of members who share common characteristics
Gender, Age, or Education level
Systematic Sample: going through the population sequentially and select members at regular intervals
Interval = Population Size/Sample Size
Simple Random Sample: every member of the population has an equal chance of being selected
the selection of any particular individual does not affect the chances of any other individual being chosen
Sampling Frame: group of individuals who actually have a chance of being sampled
Population: all individuals belonging to a group being studied
Example: A population would be all the students in your school
Raw Data: unprocessed information collected for a study
Variable: quantity being measured
Discrete Variable: only certain separate values
Methods of Organization
Indices: summarizing data and recognizing trends
Consumer Price Index: the most widely reported economic indices because it is an important measure of inflation
Cost of Living Index: cost of maintaining a constant standard of living
Inflation: a general increase in prices, which corresponds to a decrease in the value of money
Time-series graph: used to show how indices change over time
plots variable values vs. time and join the data points with straight lines.
Categorical Data: uses labels rather than numbers to illustrate data
Examples include circle graphs, pie charts, and pictographs
Relative Frequency: table or diagram that shows the frequency of a data group as fraction or percent
Cumulative Frequency Graph: show the running total of frequencies from the lowest values up
Frequency Polygon: plotted frequency vs. variable
Histogram: a special bar graph where areas are proportional to frequencies
Bar Graph: a chart or diagram that represents quantities with horizontal or vertical bars whose lengths are proportional to the quantities
When the number of measured values is large, data are usually grouped into:
Intervals
Classes
make tables and graphs easier to construct and interpret
convenient to use from 5 to 20 equal intervals that cover the entire range
Range: the smallest to the largest value of the variable
Continuous Variable: any value within a given range
