Math Test Study
Organize Secondary Data
https://docs.google.com/document/d/1a0vzYU8o9McB8WxnRSKwbVOa27oy5POUfUlLK0dKFRM/edit?usp=sharing
Main topic
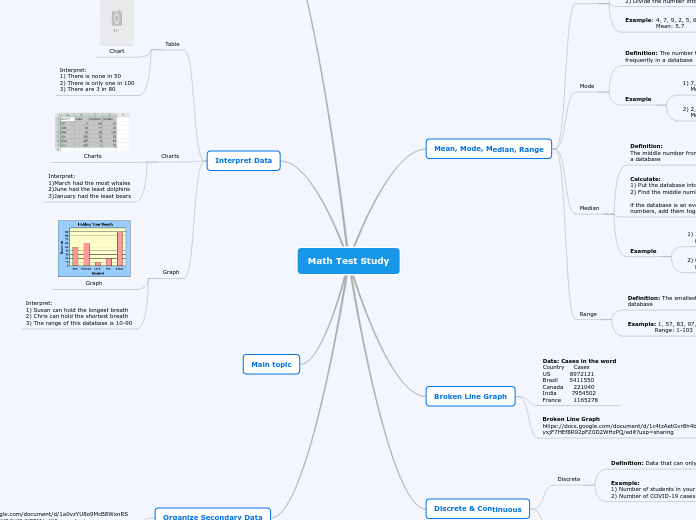
Interpret Data
Graph
Interpret:
1) Susan can hold the longest breath
2) Chris can hold the shortest breath
3) The range of this database is 10-90
Charts
Interpret:
1)March had the most whales
2)June had the least dolphins
3)January had the least bears
Table
Interpret:
1) There is none in 50
2) There is only one in 100
3) There are 3 in 80
Chart
Primary & Secondary Data
Secondary Data
Example: (Usually collected by other)
1) The number of COVID-19 in Canada
2) The number of students that completed their homework
Definition: Data was not collected by yourself
Primary Data
Example:
1) The weight of my family members
2) The length of how many hours I sleep in a week
Definition: Data was collected by yourself
Discrete & Continuous
Continuous
Example:
1) Height of a dog
2) Weight of a cat
Definition: Data that can take any values
Discrete
Example:
1) Number of students in your class
2) Number of COVID-19 cases in the world
Definition: Data that can only take certain values.
Broken Line Graph
Broken Line Graph
https://docs.google.com/document/d/1c4tzAetGvr8h4bAdE5r7yxjF7HEf8R92pFZ0D2WHzPQ/edit?usp=sharing
Data: Cases in the word
Country Cases
US 8972121
Brazil 5411550
Canada 221040
India 7954502
France 1165278
Mean, Mode, Median, Range
Range
Example: 1, 57, 83, 97, 20, 103
Range: 1-103
Definition: The smallest number to the greatest number in a database
Median
2) 6, 5, 2, 4, 1, 3
Median: 3.5
1) 1, 6, 5, 3, 4, 2, 7
Median: 4
Calculate:
1) Put the database into smallest to greatest
2) Find the middle number of the database
if the database is an even number, find the middle two numbers, add them together and divided by 2
Definition:
The middle number from the smallest number to the biggest in a database
Mode
Example
2) 2, 6, 8, 4, 5, 9
Mode: No Mode
1) 7, 4, 5, 4, 3, 4
Mode: 4
Definition: The number that appeared most
frequently in a database
Mean
Example: 4, 7, 9, 2, 5, 6, 7
Mean: 5.7
Calculate:
1) Add all the numbers in the database
2) Divide the number into the number of category there are
Definition: The average number of a database


