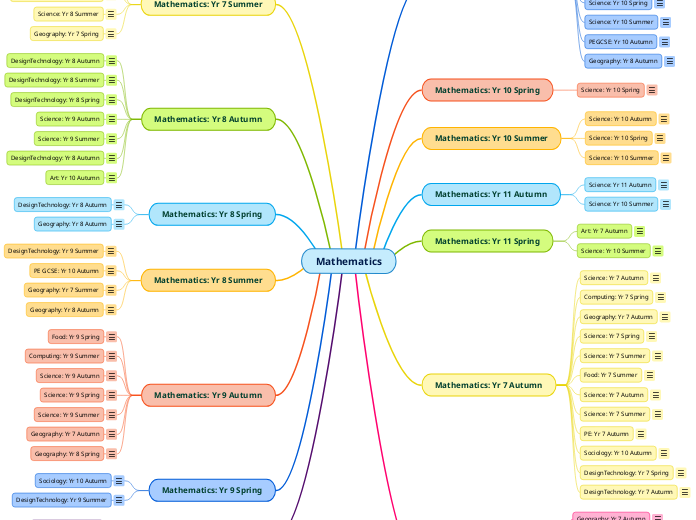
Mathematics
Mathematics: Yr 9 Summer
Geography: Yr 9 Summer
Collect primary data during field work. Tabulate, analyse and display data graphically. Draw conclusions from the data.
Computing: Yr 9 Spring
Mathematics: Yr 9 Spring
Mathematics: Yr 9 Autumn
Geography: Yr 8 Spring
Reading graphical diagrams.
Science: Yr 9 Spring
Experimental results tabulated and displayed graphically. Substituting into formulae. Using different units of measure.
Computing: Yr 9 Summer
Python coding using arithmetic expressions.
Food: Yr 9 Spring
Cost analysis of ingredients.
Mathematics: Yr 8 Summer
PE GCSE: Yr 10 Autumn
Data collection, interpreting tables and graphs/charts
DesignTechnology: Yr 9 Summer
Mathematics: Yr 8 Spring
Mathematics: Yr 8 Autumn
Art: Yr 10 Autumn
Scale drawing and similarity
Science: Yr 9 Summer
Experimental results tabulated and displayed graphically. Using different units of measure.
Science: Yr 9 Autumn
DesignTechnology: Yr 8 Spring
DesignTechnology: Yr 8 Summer
DesignTechnology: Yr 8 Autumn
Mathematics: Yr 7 Summer
Geography: Yr 7 Spring
Working with money to understand the economic benefits of tourism. Data analysis and graphical diagrams.
Science: Yr 8 Summer
Experimental results tabulated and displayed graphically. Balancing equations. Using different units of measure and calculating compound measures.
Mathematics: Yr 7 Spring
Geography: Yr 7 Summer
Use of different units of measure. Use of directed numbers working with temperature. Data analysis and graphical diagrams.
Identifying 2D shapes
Mathematics: Yr 7 Autumn
DesignTechnology: Yr 7 Autumn
Use of specialist equipment to make accurate drawings.
DesignTechnology: Yr 7 Spring
Use of specialist equipment to make accurate drawings in 3D.
Sociology: Yr 10 Autumn
Primary and secondary data analysis and different graphical diagrams.
PE: Yr 7 Autumn
Presenting data in tables.
Food: Yr 7 Summer
Reading scales
Science: Yr 7 Summer
Science: Yr 7 Spring
Geography: Yr 7 Autumn
Measuring distances using a range of scales. Using coordinate grid references.
Computing: Yr 7 Spring
Algrebraic manipulation using sequences, variables and function machines.
Science: Yr 7 Autumn
Mathematics: Yr 11 Spring
Art: Yr 7 Autumn
Understand the 2D shapes that make up 3D shapes, Plans and elevations
Mathematics: Yr 11 Autumn
Science: Yr 11 Autumn
Experimental results tabulated and displayed graphically. Numerical calculations. Data analysis.
Mathematics: Yr 10 Summer
Mathematics: Yr 10 Spring
Mathematics: Yr 10 Autumn
Geography: Yr 8 Autumn
Use of different units of measure. Data analysis and graphical diagrams to explain population changes.
PEGCSE: Yr 10 Autumn
Presenting and interpreting data.
Science: Yr 10 Summer
Science: Yr 10 Spring
Experimental results tabulated and displayed graphically. Numerical calculations. Data analysis. Using algebraic equations and formulae. Using geometry and trigonometry.
Experimental results tabulated and displayed graphically. Numerical calculations. Data analysis. Using algebraic equations and formulae.
Food: Yr 10 Summer
Food: Yr 10 Spring
Cost analysis of ingredients. Comparison of nutritional values of different ingredients.
Food: Yr 10 Autumn
Nutitional Data - Reading tables and interpreting data.
Science: Yr 10 Autumn
Experimental results tabulated and displayed graphically.
