Kategorier: Alle - patterns - interaction - timeline - analysis

af Mindomo Team 3 år siden

203

Visual Data Analysis

Understanding complex data and user behaviors requires various tools and methods. Visual data analysis aids in organizing and interpreting vast amounts of information. Techniques such as affinity diagrams help in categorizing open-ended questions to identify patterns and provide clear overviews.
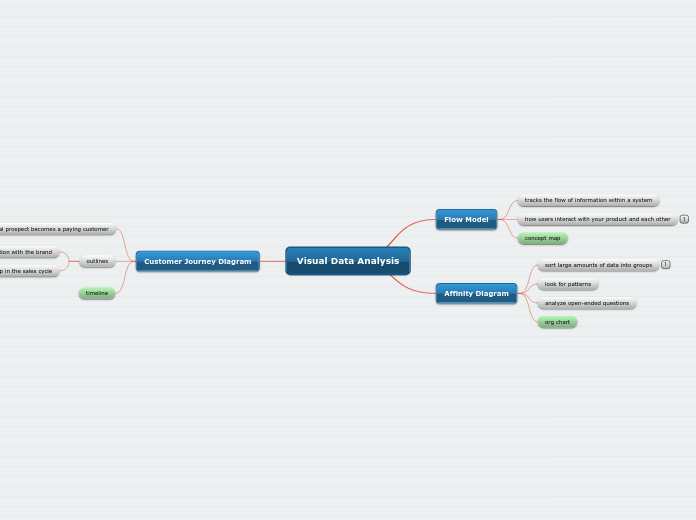

Visual Data Analysis

Visual Data Analysis

Customer Journey Diagram

timeline
outlines
every step in the sales cycle

advocacy

repurchase

awareness

first interaction with the brand
shows the way a typical prospect becomes a paying customer

Affinity Diagram

org chart
analyze open-ended questions
look for patterns
sort large amounts of data into groups
clear overview

Flow Model

concept map
how users interact with your product and each other
better needs assessment
tracks the flow of information within a system