door Mindomo Team 3 jaren geleden
242
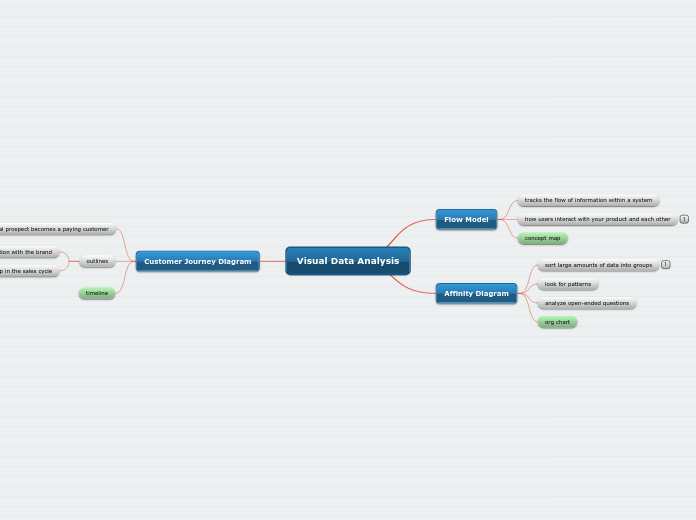
Visual Data Analysis
Understanding complex data and user behaviors requires various tools and methods. Visual data analysis aids in organizing and interpreting vast amounts of information. Techniques such as affinity diagrams help in categorizing open-ended questions to identify patterns and provide clear overviews.
