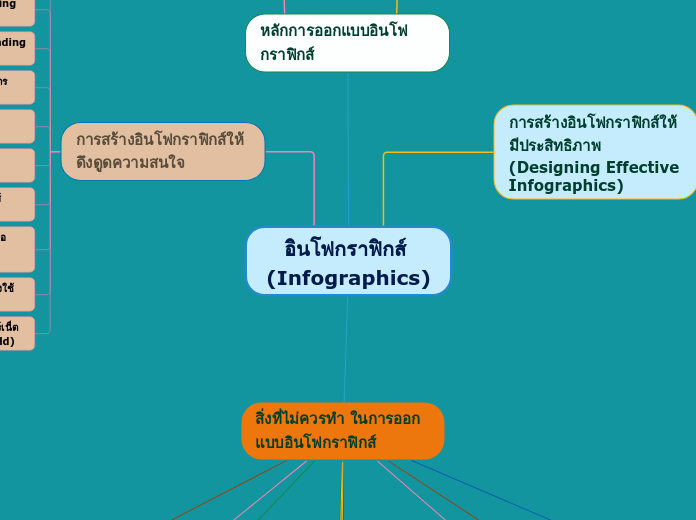
สิ่งที่ไม่ควรทำ ในการออกแบบอินโฟกราฟิกส์
10. อย่าใช้แบบเป็นวงกลม (Don’t use a circus layout)
9. อย่าเน้นที่การออกแบบ (Don’t focus on design)
8. อย่านำ เสนอข้อมูลที่ผิด (Don’t present wrong information.)
7. อย่าใช้วิธีการพิมพ์ผิด (Don’t misuse typography)
6. อย่าสร้างอินโฟกราฟิกส์ให้น่าเบื่อ (Don’t make it boring)
5. อย่าละเลยข้อมูลที่ไม่สามารถระบุแยกแยะได้ (Don’t leave figures unidentified)
4. อย่าใส่ตัวเลขมากเกินไป (Don’t place too much numbers)
3. อย่าใช้สีมากเกินไป (Don’t overuse color)
2. อย่าทำ ข้อมูลที่นำ เสนอให้ยุ่งยากซับซ้อน (Don’t make confusing data presentation)
1. อย่าใช้ข้อมูลมากเกินไป (Don’t use too much text)
หลักการออกแบบอินโฟกราฟิกส์
2. ด้านการออกแบบ
1. ด้านข้อมูล
อินโฟกราฟิกส์ (Infographics)
In physics, energy is the quantitative property that must be transferred to an object in order to perform work on, or to heat, the object. Energy is a conserved quantity; the law of conservation of energy states that energy can be converted in form, but not created or destroyed
การสร้างอินโฟกราฟิกส์ให้ดึงดูดความสนใจ
Solar energy begins with the sun. Solar panels are used to convert light from the sun, which is composed of particles of energy called 'photons', into electricity that can be used to power electrical loads.
Write down the benefits of using solar panels.
10. การแบ่งปันความรู้ในอินเทอร์เน็ต (Releasing it into the world)
9. การตรวจสอบข้อมูลและทดลองใช้ (Refinement and testing)
8. การกำ หนดภาพให้ตรงกับหัวข้อ (Determining a visual approach)
7. การเลือกรูปแบบอินโฟกราฟิกส์ (Choosing a format)
6. การออกแบบโครงสร้างข้อมูล (Building a wireframe)
5. การจัดลำ ดับโครงสร้างข้อมูล (Creating a hierarchy)
4. การระบุปัญหาและความต้องการ (Identifying problems)
3. การค้นหาวิธีการเล่าเรื่อง (Finding the narrative)
2. การอ่านข้อมูลทั้งหมด (Reading everything)
1. การรวบรวมข้อมูล (Gathering data)
การสร้างอินโฟกราฟิกส์ให้มีประสิทธิภาพ (Designing Effective Infographics)
10. ทำ ไฟล์อินโฟกราฟิกให้เล็ก (Make the file size small)
9. ตรวจสอบตัวเลขข้อมูล Check your numbers)
8. ใช้คำ พูดที่กระชับ (Use short texts)
7. ใช้สีที่ดึงดูดความสนใจ (Choose attractive colors)
6. การออกแบบที่ดีทำ ให้มีประสิทธิภาพ (Good design is effective)
5. ให้อินโฟกราฟิกเป็นตัวเล่าเรื่อง (Let it tell a story)
4. แน่ใจว่าข้อเท็จจริงถูกต้อง (Be sure facts are correct)
3. ข้อมูลเป็นสิ่งสำ คัญ (Data is important)
2. ออกแบบให้เข้าใจง่าย (Keep it simple)
1. เน้นที่หัวข้อหลักหัวข้อเดียว (Focus on a single topic)
