Bivariate statistical measures of regression and correlation
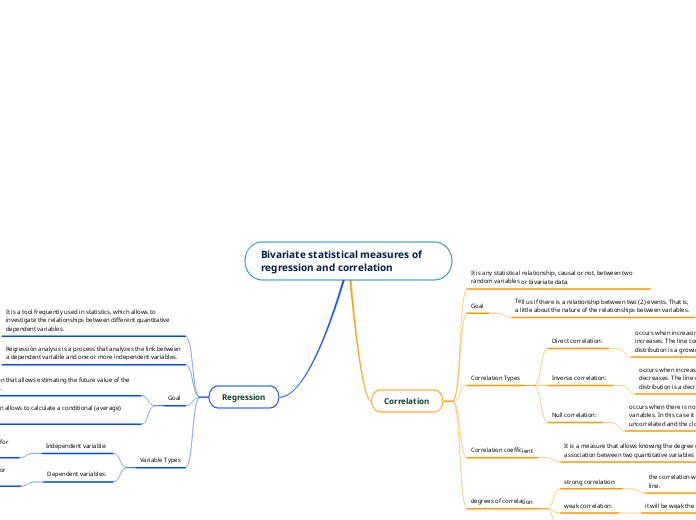
Regression
Variable Types
Dependent variables:
are the attributes on which we want to measure changes or make predictions.
Independent variable:
they represent inputs or causes, that is, potential reasons for variation.
The regression allows to calculate a conditional (average) expectation.
Build a function that allows estimating the future value of the study variable.
Regression analysis is a process that analyzes the link between a dependent variable and one or more independent variables.
It is a tool frequently used in statistics, which allows to investigate the relationships between different quantitative dependent variables.
Correlation
degrees of correlation
null correlation:
here there is no type of pattern or relationship between them.
weak correlation:
it will be weak the further apart the points are on the line.
strong correlation:
the correlation will be strong the closer the points are to the line.
Correlation coefficient
It is a measure that allows knowing the degree of linear association between two quantitative variables (X, Y).
Correlation Types
Null correlation:
occurs when there is no dependency of any kind between the variables. In this case it is said that the variables are uncorrelated and the cloud of points has a rounded shape.
Inverse correlation:
occurs when increasing one of the variables, the other decreases. The line corresponding to the cloud of points of the distribution is a decreasing line.
Direct correlation:
occurs when increasing one of the variables, the other increases. The line corresponding to the cloud of points of the distribution is a growing line.
Goal
Tell us if there is a relationship between two (2) events. That is, a little about the nature of the relationships between variables.
It is any statistical relationship, causal or not, between two random variables or bivariate data.


