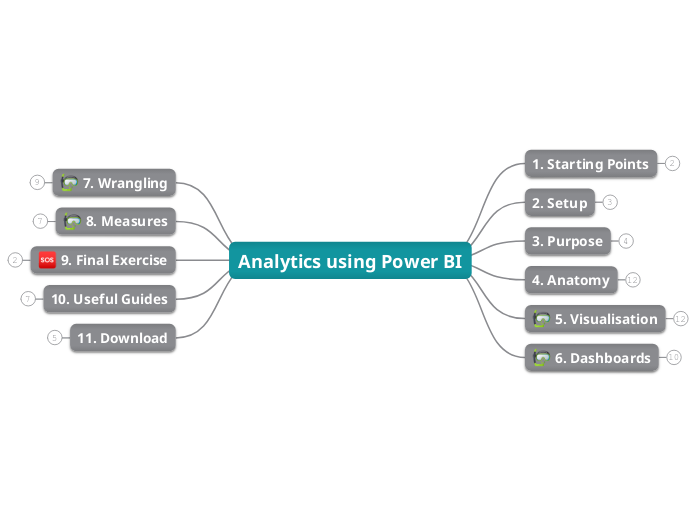
Analytics using Power BI
11. Download
DAX
Model
GII
Gapminder
Course Materials
10. Useful Guides
https://docs.microsoft.com/en-us/power-bi/whitepapers
https://azure.microsoft.com/en-us/solutions/architecture/modern-data-warehouse/
https://docs.microsoft.com/en-gb/powerquery-m/index\
https://docs.microsoft.com/en-gb/dax/
https://pbicheatsheet.blob.core.windows.net/pbicheatsheet/Macaw%20Power%20BI%20cheat%20sheet%20EN.pdf
https://www.techrepublic.com/article/microsoft-power-bi-a-smart-persons-guide/
https://docs.microsoft.com/en-us/power-bi/
9. Final Exercise
A What If Scenario Tool
EnterpriseDNA: Scenario Analysis in PBI
8. Measures
Calculated Measures Scenario
XXLBI: Regression in DAX
SQLBI: Row and Filter Context
Power BI delivers descriptive or diagnostic insights...
DAX Patterns: Pattern Book
Microsoft: DAX Quickstart
Microsoft: DAX Guide
7. Wrangling
Data Wrangling Scenario (Data Models)
Microsoft: Models in Power BI Desktop
Data Wrangling Scenario (Data Design)
Microsoft: Power Query Editor
ExceleratorBI: Data Design in Power BI
Preparing data for use is a key challenge...
Microsoft: Row Level Security
Microsoft: Understand the Star Schema
Microsoft: Database Design Basics
6. Dashboards
Dashboard Mechanics Scenario
Microsoft: Retail Analysis
Microsoft: Drills in Power BI
Microsoft: Filters in Power BI
Microsoft: Bookmarks in Power BI
Microsoft: Cards in Power BI
Microsoft: Slicers in Power BI
Dashboards should be designed for purpose...
UX Planet: Better Dashboard Design
Juice: A Guide to Creating Dashboards
5. Visualisation
Visual Analytics Scenario
Gapminder: The Gapminder Visual
Our work in Power BI will adopt a simple workflow...
Map and Fire: Jobs to be Done
The goal of visual analytics is to deliver insight...
Microsoft: Power BI Showcase
Datapine: Types of Dashboard
UND: University Dashboards
MTU: University Dashboards
NDUS: University Dashboards
PLOS: 10 Simple Rules for Better Charts
Tibco: What is Data Science?
4. Anatomy
Power BI is deployed in a pipeline architecture...
Microsoft: Enterprise Business Intelligence
Microsoft: Big Data Architectures
Introduction to Power BI Online
Key2Consulting: Power BI Pricing
Microsoft: Sharing and Licenses
Microsoft: PBI Service Overview
Introduction to Power BI Desktop
Microsoft: PBI Desktop Overview
Power BI has several components...
SQL Dusty: Power BI Architecture
Microsoft: PBI Desktop and PBI Service
3. Purpose
Power BI is a Business Intelligence solution...
Tableau: What is Business Intelligence?
IBM: What is Business Intelligence?
Microsoft: What is Business Intelligence?
2. Setup
Create a Power BI Online Account
Download Power BI Desktop
Download Datasets
1. Starting Points
Mindomo Link
Course Objectives
