Measures of asymmetry and pointing
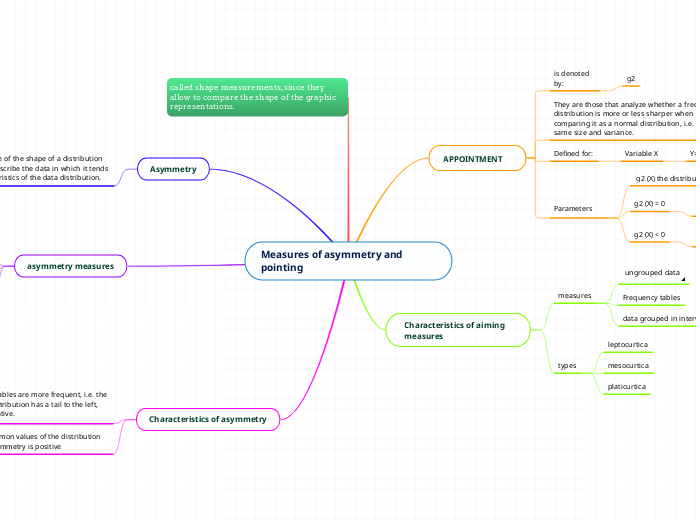
Characteristics of asymmetry
when the most common values of the distribution are smaller, this asymmetry is positive
the values of the variables are more frequent, i.e. the highest and if the distribution has a tail to the left, this skewness is negative.
asymmetry measures
is defined as a central moment of order 3 and standard deviation raised to the cube
is denoted by g1
to measure the skewness of a distribution, different coefficients are used, in which the so-called skewness coefficient can be obtained.
Asymmetry
It is such a measure of the shape of a distribution that allows us to describe the data in which it tends to identify characteristics of the data distribution.
called shape measurements, since they allow to compare the shape of the graphic representations.
Characteristics of aiming measures
types
platicurtica
mesocurtica
leptocurtica
measures
data grouped in intervals
Frequency tables
ungrouped data
APPOINTMENT
Parameters
g2 (X) < 0
The distribution is platicurtic, more flattened than normal.
g2 (X) = 0
Its distribution is mesocurtic, i.e., the same as the normal distribution.
g2 (X) the distribution is leptokurtic
Defined for:
Variable X
Y= X-B
They are those that analyze whether a frequency distribution is more or less sharper when comparing it as a normal distribution, i.e. with the same size and variance.
is denoted by:
g2
