Kategoriak: All - mode - median - mean

arabera Amanda Higginson 12 years ago

264

Monday 10-22-12

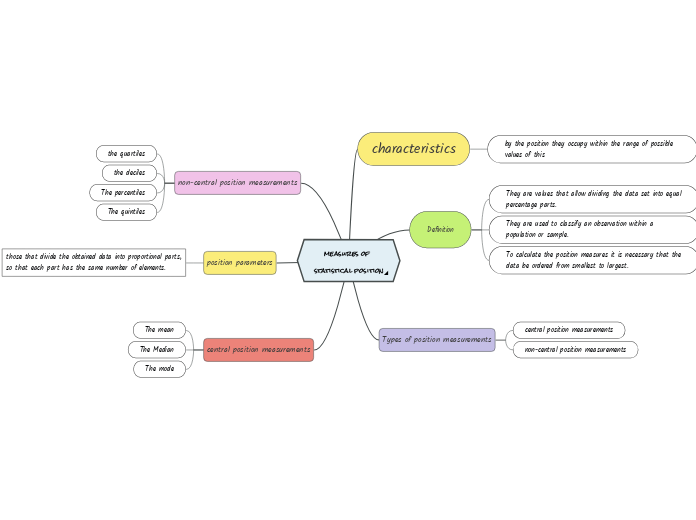
Understanding statistical concepts is crucial for data analysis, particularly when dealing with large datasets. Quartiles play an essential role by dividing data into four equal parts, with the lower quartile representing the median of the lower half and the upper quartile indicating the median of the upper half.
Monday 10-22-12

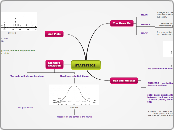
STATISTICS!

Standard Deviation

Used to create Bell Curve

Measure of the center is the MEAN

*Formula will always be given
But just incase...

Line Plots

Quartiles: Divide the data set into four sections. Each section containing about 1/4 of the data.
QU: The upper quartile, find the median of the upper set of data points
QL: The lower quartile, find the median of the LOWER SET of data points.

Box and Whisker

OUTLIERS- How to figure out if numbers in a set of data are outliers:
IQR= Inter Quartile Range or, the distance between the lower quartile and the upper quartile. To be an Outlier, the number must be at least 1.5 X IQR.

Example: The Lower quartile is 13 and the Upper Quartile is 17... The IQR is 4. 1.5 X 4 = 6. So for a number in the data set to be an Outlier it must be +/- 6 from the quartiles.

Subtopic
Remember to include a number line underneath (to keep things evenly spaced and to scale)
Be careful of SKEWING or SKEWED data!!

The Three Ms

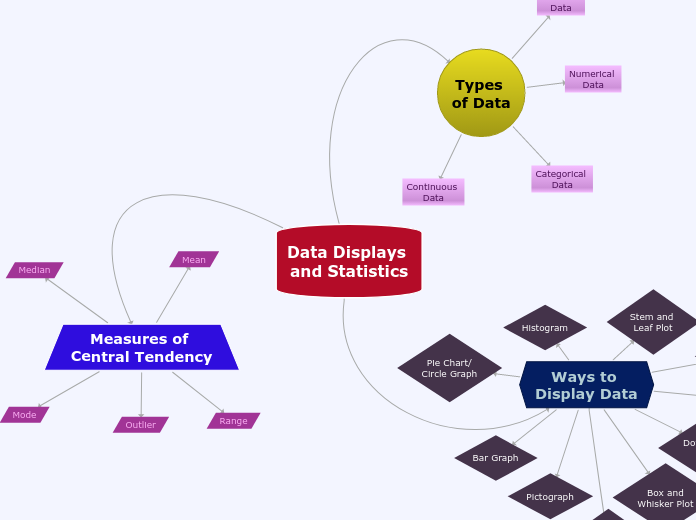
MODE
The number that occurs the MOST in a set. You CAN have more than one mode.
MEDIAN
The Middle Number. Order your numbers from least to greatest, then find the middle number.
MEAN
Average- Add the numbers in your set and divide by the amount of numbers in your set. Combine and divide out equally.